How to Read Oracle AWR report?
How to read AWR report?
Next>> How to use Oracle SQL Advisor ?
1. Initial sections provides details for the instance.

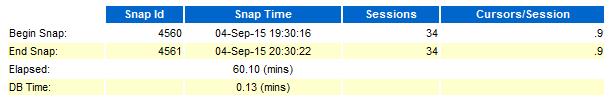
The section with DB Name is important as it provides you details like RAC/Versions/Instance/etc.
Observation:- From this section you need to ensure that you are analysing AWR performance report for the instance having issue from a particular SNAPSHOT.
2. Load Profile
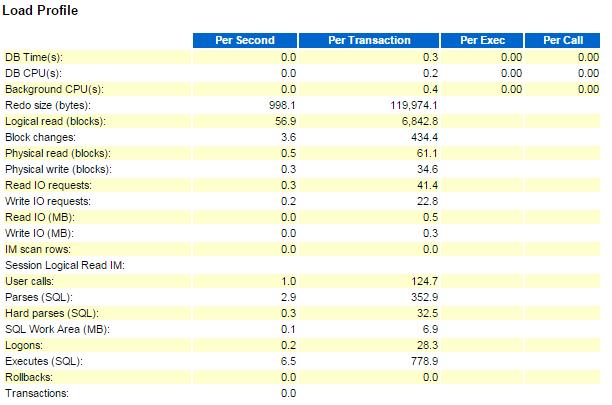
Observation:-
Here "DB CPU(s)" per second will show if your system is CPU bound, meaning needed more CPUs. If the Per Second value for DB CPU(s) is greater than the number of cores on DB server, then you need to add more CPUs.
Parses(SQL) and Hard parses(SQL) - If the ratio of hard parse to parse is high, this means Database is performing more hard parse. So, needs to look at parameters like cursor_sharing and application level for bind variables etc.
3. Instance efficiency Percentages
Here most of the performance parameters should be close to 100%.
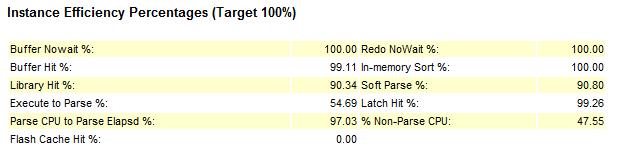
Observation:-
Buffer Nowait %: This shows the percentage of time SQL has not waited to receive blocks from data buffer. The percentage closer to 100 is better.
Buffer Hit %: This shows the percentage of time SQL has read from Buffer. If the max. read happens from buffer, your instance performance is considered better. If it is lower then, your database SQL is using disk blocks instead of memory.
Library Hit %: This shows the amount of time package or pl/sql code were found in Shared Pool. If the max. read happens from buffer, your instance performance is considered better.
Execute to Parse%: Shows how often already parsed SQL are used without new parse
Flash Cache Hit%: The higher percentage shows most of the reads were coming from the flash cache, not the disks. For Exadata environment, this should be a higher value.
4. Top 10 Foreground Events by Total Wait Time
Look for top wait events
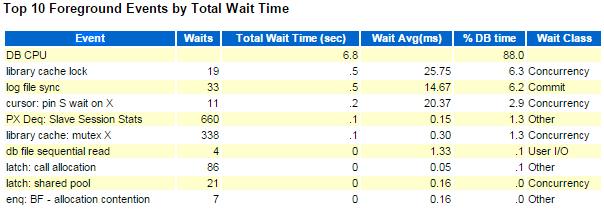
Observation:-
DB CPU : Not all the time high DB CPU is a problem. But If you find DB CPU percentage to be very high like 80-85%, you should check the "SQL ordered by CPU Time" . Find the sql ID that makes CPU DB busy and start to look for the execution plan for any improvements on SQL.
Library cache lock : Library cache(Parse locks) are needed to maintain dependency mechanism between objects and their dependents. For example, if a column is dropped from a table then all the SQLs dependent upon table must be invalidated and reparsed during next access to that object. Library cache locks are designed to implement this tracking mechanism.
Library cache lock controls concurrency between clients in the library cache. The library cache lock acquires a lock on the object handle so that either:
There is a hidden Oracle database initialization parameter called kgl_latch_count which controls behavior in terms of the number of library cache latches created within the Oracle database.
The default value for kgl_latch_count is set to the following prime number plus value of the database initialization parameter for cpu_count. The maximum allowable value for kgl_latch_count is no greater than 66
In the event that there should be a library cache contention issue and no other recourse is available to resolve the contention with the library cache latch, this value can be increased.
Log file sync : When user session COMMITs (or rolls back), the sessions redo information needs to be written into the redo log file. The user session indicates LGWR to write all redo required from the log buffer to the redo log file. When the LGWR has finished it will indicate back to user session to confirm all redo changes are safely written on disk.
Try doing one of following:
If there are lots of short duration transactions, see if it is possible to BATCH transactions together so there are fewer distinct COMMIT operations. Each commit has to have it confirmed that the relevant REDO is on disk.
Determine whether any activity can safely be done with NOLOGGING / UNRECOVERABLE options.
Library cache mutex X : Mutexes or mutual exclusion algorithms are lighter and more granular concurrency mechanism than latches and are used in concurrent programming to avoid the simultaneous use of a common resource.This happens when many sessions tries to use/update same block. Oracle obtains mutex to ensure that certain operations are properly managed for concurrency but the management itself leads to concurrency.
Run a query against the x$kglob table to find the names of the objects being pinned most of the time.
select case when (kglhdadr = kglhdpar) then 'Parent' else 'Child '||kglobt09 end cursor,
kglhdadr ADDRESS, substr(kglnaobj,1,20) NAME, kglnahsh HASH_VALUE, kglobtyd TYPE,
kglobt23 LOCKED_TOTAL, kglobt24 PINNED_TOTAL,kglhdexc EXECUTIONS, kglhdnsp NAMESPACE
from x$kglob -- where kglobtyd != 'CURSOR'
order by kglobt24 desc)
where rownum <= 20;
If you have issues with PL/SQL packages and procedures, use dbms_shared_pool.markhot() to mark them as hot. It could also be related to any known bug from Oracle.
enq: TX - row lock contention : This is the concurrency issue between sessions. Sometimes it happens with poor application design. Try to identify the objects/SQLs participating in contention. A tuning of those SQLs may help in reducing the contention.
db file sequential read : When the db-block is not available in buffer-cache, it performs an I/O operation using indexes and places the object in buffer cache. If I/O subsystem is very fast, for example if OS can find required data in the filesystem cache, wait time will be close to zero.
If the db file sequential read is very high, you may want to engage your storage group to look for any storage bottleneck. Also, in your AWR report identify SQLs which are performing high reads from SQL Statistics section of AWR.
Apart from sequential read, Oracle also has various wait events associated with I/O. It can be any of these below.
db file scattered read : It is usually a multi-block read up to DB_FILE_MULTIBLOCK_READ_COUNT blocks. In this, data is read into multiple discontinuous locations in the memory. And that's why the word scatter.
It can happen for a table scan using index or full table scan. When performing a full table scan into the buffer cache, the blocks read are read into memory locations that are not physically adjacent to each other. For scan operations (index range scans, index fast full scans, and full-table scans), a read-ahead cache can be very useful for speeding up these "scattered read" operations.
direct path read : In a direct read, Oracle reads from a data file that bypasses the buffer cache and reads the data block directly into process-private memory.
Many of the times this wait event is misleading as, The total number of waits does not reflect the number of I/O requests. The total time spent in "direct path read" does not always reflect the true wait time. These kind of read requests are typically used for:
During heavy batch periods, waits on "direct path read" are normal. However, if the waits are significant on an OLTP style system, there may be a problem. You can,
direct path read temp : When a session reads buffers from disk directly into the PGA, the wait is on direct path read temp. It often shows up when the PGA is not able to support the size of the sorts.
If the I/O subsystem doesn’t support asynchronous I/Os, then each wait corresponds to a physical read request.
If the I/O subsystem supports asynchronous I/O, then the process overlaps read requests with processing the blocks already in the PGA. When the process attempts to access a block in the PGA that has not yet been read from disk, it issues a wait call.
Try increasing pga_aggregate_target.
direct path write temp : The "direct path write temp" wait event and "direct path write" wait event can occur when a process is writing buffers directly from PGA. The process will wait on this event for the write call to complete. Operations that could perform direct path writes include when a
Like direct path reads, the number of waits is not the same as number of write calls issued if the I/O subsystem supports asynchronous writes. The session will wait if it has processed the buffers in the PGA and can’t continue work until an I/O request completes.
Try increasing pga_aggregate_target.
free buffer wait : The free buffer wait is an Oracle metric that has generally been considered to be related to the database writer (DBWR). If the dirty blocks are not being cleared fast enough by the DBWR and some server process is reporting that it is unable to find a free buffer. This results in a free buffer wait.
A dirty buffer is one whose contents have been modified. Dirty buffers are freed for reuse once the DBWR has written the blocks to disk.
But if all the buffers are either dirty or pinned the session has to wait for a buffer to become available – either when the database writer cleans some buffers (by copying them to disc) or when some pinned buffers are finally released.
Try increasing the size of buffer cache. It could be related to Oracle Bug as well, where DBWR is unable to clean dirty buffer.
5. SQL ordered by Elapsed Time
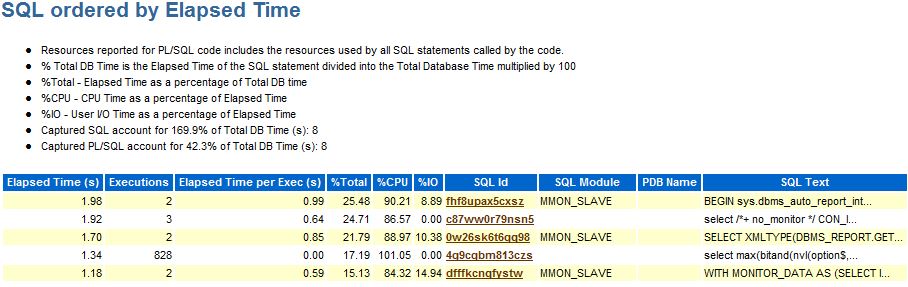
Observation:- Look for query has low executions and high Elapsed time per Exec (s) and this query could be a candidate for performance optimizations.
In above report, you can see first query has maximum Elapsed time but few execution. So you have to investigate this if elapsed time is significantly higher.
6. SQL ordered by CPU Time
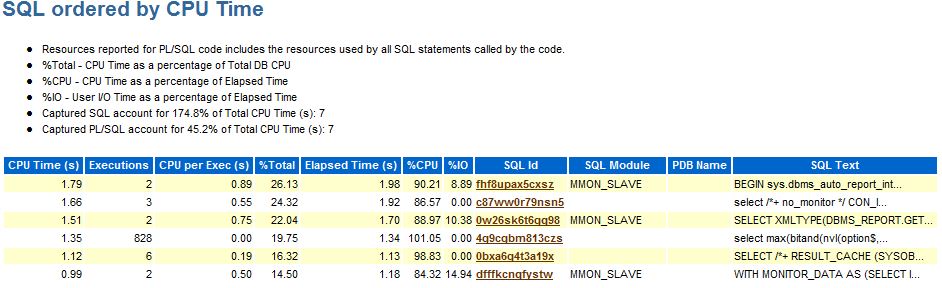
Observation:- SQL queries are listed on the basis of CPU taken by the query i.e. queries causing high load on the system. The top few queries could be the candidate query for optimization.
7. Time Model Statistics
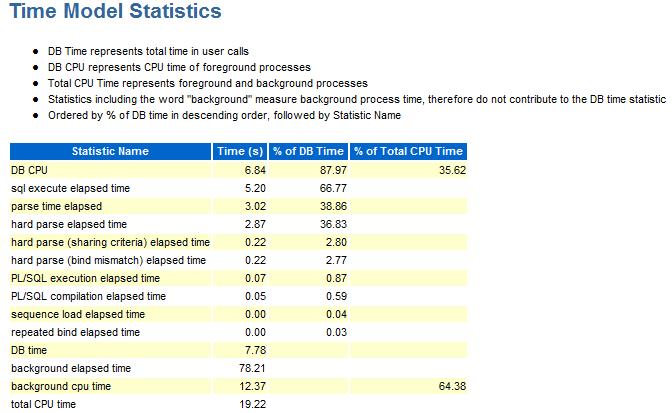
Observation:- This is a detailed explanations of system resource consumptions.
8. Operating System Statistics
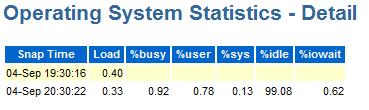
Observation:- This provides details of your Operating system and the resource consumptions.
9. Service Statistics
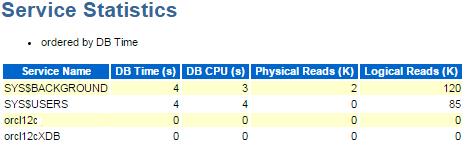
Observation:- This provides details of your database services and their utilizations. The service statistics section gives information about how particular services configured in the database are operating.
10. Advisory Statistics
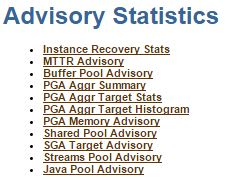
Observation:- This section show details of the advisories for the buffer, shared pool, PGA and Java pool.
11. Segment Statistics
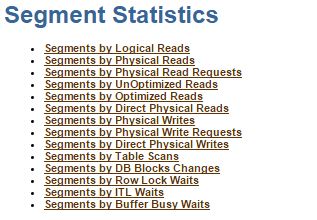
Observation:- This provides details of your Operating system and the resource consumptions.